The traditional route to high strength in steels is by quenching to form martensite
which is subsequently reheated or tempered at an intermediate temperature, increasing
the toughness of the steel without too great a loss in strength. Therefore, for the
optimum development of strength, steel must be first fully converted to martensite.
To achieve this, the steel must be quenched at a rate sufficiently rapid to avoid the
decomposition of austenite during cooling to such products as ferrite, pearlite and
bainite. The effectiveness of the quench will depend primarily on two factors:
- the geometry of the specimen, and
- the composition of the steel.
It has already been shown that the addition of alloying elements to a steel usually
move the TTT curve to longer times, thus making it easier to pass the nose of the
curve during a quenching operation, i.e. the presence of alloying elements reduces
the critical rate of cooling needed to make a steel specimen fully martensite. If
this critical cooling rate is not achieved a steel rod will be martensitic in the
outer regions which cool faster but, in the core, the slower cooling rate will
give rise to bainite, ferrite and pearlite depending on the exact circumstances.
The ability of steel to form martensite on quenching is referred to as the hardenability.
This can be simply expressed for steel rods of standard size, as the distance below
the surface at which there is 50% transformation to martensite after a standard
quenching treatment, and is thus a measure of the depth of hardening.
Use of TTT and CCT Diagrams
TTT diagrams- TTT diagrams provide a good starting point for an examination
of hardenability, but as they are statements of the kinetics of transformation of
austenite carried out isothermally, they can only be a rough guide. To take one example,
the effect of increasing molybdenum, Figure 1. shows the TTT diagrams for a 0.4 %C 0.2%
Mo steel and steel with 0.3 %C 2 % Mo, Figure 2. The 0.2%
Mo steel begins to transform in about one second at 550°C, but on
increasing the molybdenum to 2% the whole C-curve is raised and the reaction substantially
slowed so that the nose is above 700°C, the reaction starting after 4 minutes.
The latter steel will clearly have a greatly enhanced hardenability over that of the
0.2 Mo steel.
CCT diagrams- The obvious limitations of using isothermal diagrams for
situations involving a range of cooling rates through the transformation temperature
range have led to efforts to develop more realistic diagrams, i.e. continuous cooling
(CCT) diagrams. These diagrams record the progress of the transformation with falling
temperature for a series of cooling rates. They are determined using cylindrical rods,
which are subjected to different rates of cooling, and the onset of transformation is
detected by dilatometry, magnetic permeability or some other physical technique. The
products of the transformation, whether ferrite, pearlite or bainite, are partly
determined from isothermal diagrams, and can be confirmed by metallographic
examination.
The results are then plotted on a temperature/cooling time diagram, which records, for
example, the time to reach the beginning of the pearlite reaction over a range of cooling
rates. This series of results will give rise to an austenite-pearlite boundary on the
diagram and likewise lines showing the onset of the bainite transformation can be
constructed.
A schematic diagram is shown in Figure 3. in which the boundaries for ferrite, pearlite,
bainite and martensite are shown for hypothetical steel. The diagram is best used by
superimposing a transparent overlay sheet with the same scales and having lines
representing various cooling rates drawn on it. The phases produced at a chosen
cooling rate are those which the superimposed line intersects on the continuous
cooling diagram. In Figure 3. two typical cooling curves are superimposed for the surface
and the centre of an oil-quenched 95 mm diameter bar. In this example, it should be
noted that the centre cooling curve intersects the bainite region and consequently
some bainite would be expected at the core of the bar after quenching in oil.
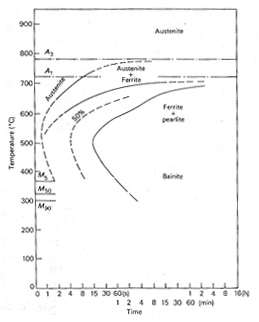
Figure 1. TTT diagram of a molybdenum steel 0.4C 0.2Mo
|
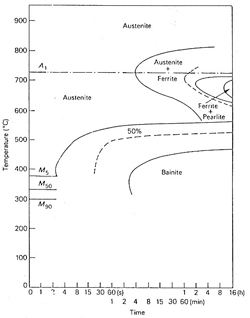
Figure 2. TTT diagram of a molybdenum steel 0.3C 2.0Mo
|
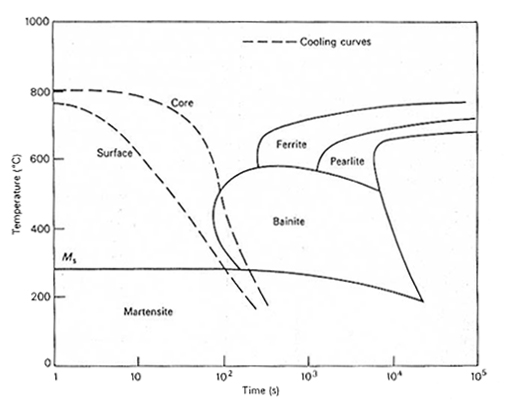
Figure 3. Relation between cooling curves for the surface and core of an
oil-quenched 95 mm diameter bar and the microstructure
|
Hardenability Testing
The rate at which austenite decomposes to form ferrite, pearlite and bainite is
dependent on the composition of the steel, as well as on other factors such as the
austenite grain size, and the degree of homogeneity in the distribution of the alloying
elements. It is extremely difficult to predict hardenability entirely on basic principles,
and reliance is placed on one of several practical tests, which allow the hardenability
of any steel to be readily determined:
- The Grossman test
- The Jominy end quench test
Effect of Grain Size and Chemical Composition on Hardenability
The two most important variables which influence hardenability are grain size and
composition.
The hardenability increases with increasing austenite grain size, because the grain
boundary area is decreasing. This means that the sites for the nucleation of ferrite
and pearlite are being reduced in number, with the result that these transformations
are slowed down, and the hardenability is therefore increased.
Likewise, most metallic alloying elements slow down the ferrite and pearlite reactions,
and so also increase hardenability. However, quantitative assessment of these effects is
needed.
There are a bewildering number of steels, the compositions of which are usually complex
and defined in most cases by specifications, which give ranges of concentration of the
important alloying elements, together with the upper limits of impurity elements such
as sulfur and phosphorus.
While alloying elements are used for various reasons, the most important is the
achievement of higher strength in required shapes and sizes and often in very large
sections which may be up to a meter or more in diameter in the case of large shafts and
rotors. Hardenability is, therefore, of the greatest importance, and one must aim for the
appropriate concentrations of alloying element needed to harden fully the section of
steel under consideration. Equally, there is a little point in using too high a
concentration of alloying element, i.e. more than that necessary for full hardening of
the required sections.
Alloying elements are usually much more expensive than iron, and in some cases are
diminishing natural resources, so there is additional reason to use them effectively
in heat treatment. Carbon has a marked influence on hardenability, but its use at higher
levels is limited, because of the lack of toughness which results, the greater
difficulties in fabrication and, most important, increased probability of distortion
and cracking during heat treatment and welding.
The most economical way of increasing the hardenability of plain carbon steel is to
increase the manganese content, from 0.60 wt% to 1.40 wt%, giving a substantial
improvement in hardenability. Chromium and molybdenum are also very effective, and
amongst the cheaper alloying additions per unit of increased hardenabilily. Boron
has a particularly large effect when it’s added to fully deoxidized low carbon
steel, even in concentrations of the order of 0.001%, and would be more widely used if
its distribution in steel could be more easily controlled.
Hardenabilily data now exists for a wide range of steels in the form of maximum and
minimum end-quench hardenability curves, usually referred to as hardenability bands.
This data is, available for very many of the steels listed in specifications such as
those of the American Society of Automotive Engineers (SAE), the American Iron and
Steel Institute (AISI) and the British Standards.
List of Articles - Knowledge Base