|
Engineering Stress-strain Curve: Part One |
|
|
|
|
|
The shape and magnitude of the stress-strain curve of a metal will depend on its composition, heat treatment, prior history of plastic deformation, and the strain rate, temperature, and state of stress imposed during the testing. The parameters, which are used to describe the stress-strain curve of a metal, are the tensile strength, yield strength or yield point, percent elongation, and reduction of area. The first two are strength parameters; the last two indicate ductility.
An example of the engineering stress-strain curve for a typical engineering alloy is shown in Figure 1. From it some very important properties can be determined. The elastic modulus, the yield strength, the ultimate tensile strength, and the fracture strain are all clearly exhibited in an accurately constructed stress strain curve.
Figure 1: An example of the engineering stress strain curve for a typical engineering alloy
The elastic modulus, E (Young’s modulus) is the slope of the elastic portion of the curve (the steep, linear region) because E is the proportionality constant relating stress and strain during elastic deformation: σ = Eε.
The 0.2% offset yield strength is the stress value, σ0.2%YS of the intersection of a line (called the offset) constructed parallel to the elastic portion of the curve but offset to the right by a strain of 0.002. It represents the onset of plastic deformation.
The ultimate tensile strength is the engineering stress value or σuts, at the maximum of the engineering stress-strain curve. It represents the maximum load, for that original area, that the sample can sustain without undergoing the instability of necking, which will lead inexorably to fracture.
The fracture strain is the engineering strain value at which fracture occurred.
At the outset, though, a clear distinction must be made between a true stress-true strain curve and an engineering stress-engineering strain curve. The difference is shown in Figure 2, which are plotted, on the same axes, the stress-strain curve and engineering stress-strain curve for the same material. The difference is also evident in the definitions of true stress-true strain and engineering stress-engineering strain.
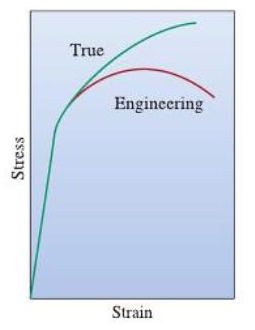
Figure 2: Comparison of engineering and true stress-strain curves
The engineering stress is the load borne by the sample divided by a constant, the original area. The true stress is the load borne by the sample divided by a variable the instantaneous area. Note that the true stress always rises in the plastic, whereas the engineering stress rises and then falls after going through a maximum.
The maximum represents a significant difference between the engineering stress-strain curve and the true stress-strain curve. In the engineering stress-strain curve, this point indicates the beginning of necking. The ultimate tensile strength is the maximum load measured in the tension test divided by the original area.
The KEY to METALS database brings global metal properties together into one integrated and searchable database. Quick and easy access to the mechanical properties, chemical composition, cross-reference tables, and
more provide users with an unprecedented wealth of information. Click the buttons below to learn more from the Guided Tour or to test drive the KEY to METALS database.
|
|
|
|